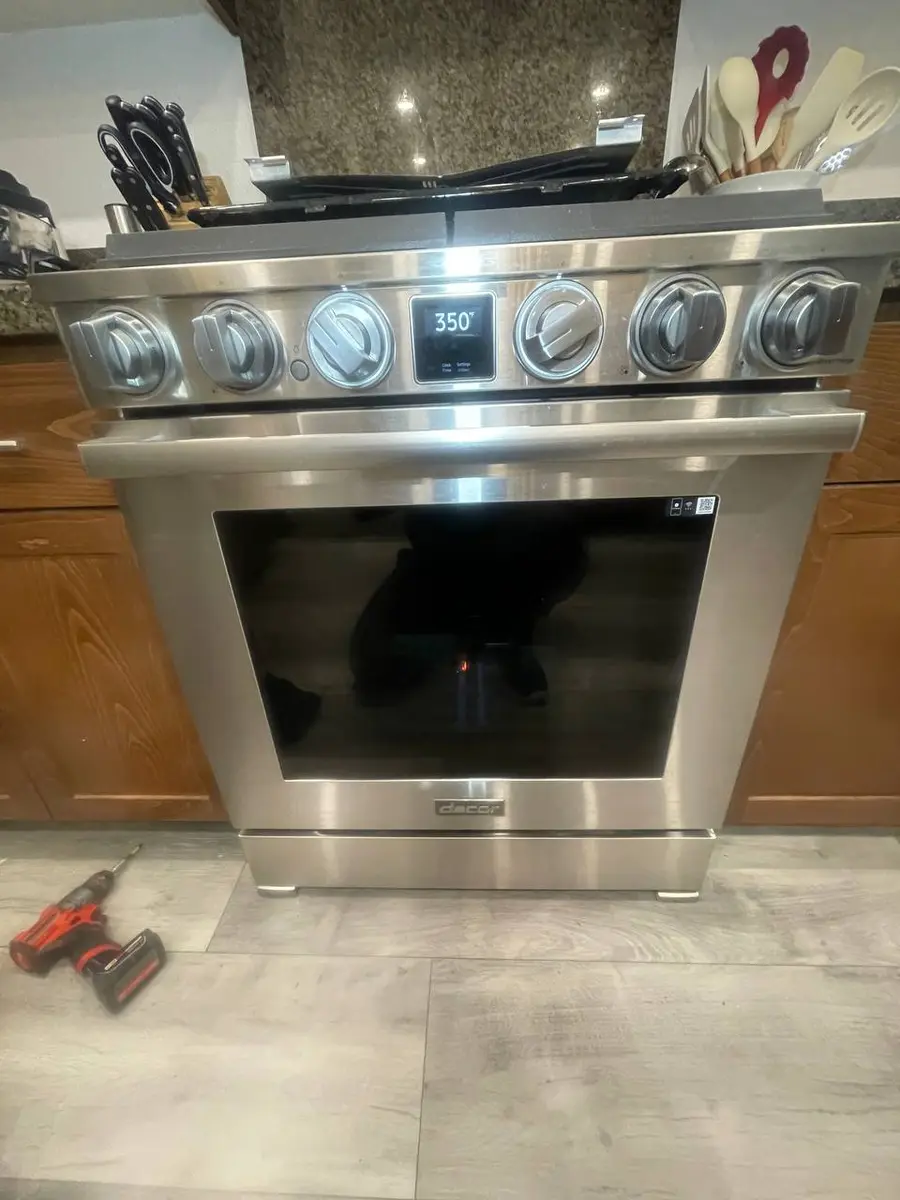
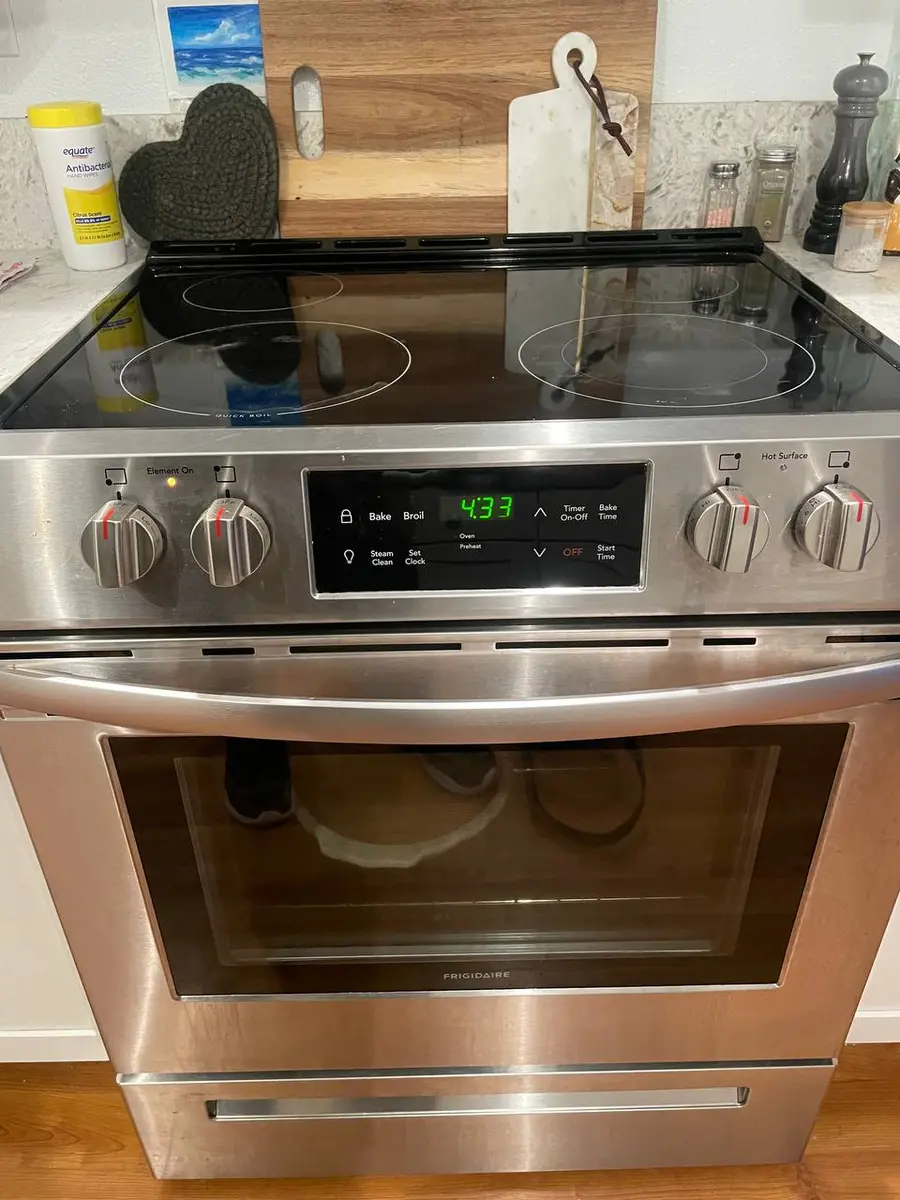
What this GE vs Whirlpool comparison is based on#
Two sets of federal incident reports are counted here and nothing else: 960 CPSC SaferProducts reports filed against GE ovens between 2011 and 2026, and 635 filed against Whirlpool ovens across the same years. A report is a submission — from an owner, an agency or a manufacturer — so these are counts of what got reported, not of what got built, sold or installed.
A comparison that comes back level#
Most brand-versus-brand pages exist because the two sides look different. This one does not. The control board leads both corpora at 6%, the heating element is named in 4% of the GE reports and 4% of the Whirlpool ones, and the thermostat or sensor sits at 1% on both sides. The two widest gaps on the page are the igniter and the wiring or power cord, and each is a single percentage point.
Read the two tables below together and the ranking barely moves: control board first, then a cluster of igniter, heating element and wiring, then a long tail. Whatever separates these two brands as products, it does not show up in which components their reported oven incidents name.
What a level result is good for#
A null result is still a result, and it does two useful things. It rules out the shortcut a shopper is usually offered — that one of these brands concentrates its trouble somewhere the other does not — and it turns the page into a single shared shortlist. If an oven of either brand is being diagnosed, the components that dominate both corpora are the same four, and the control board is the most reported of them at 6% either way.
It also sets a floor for reading the rest of this class. No component rises above the control board's 6% in either corpus, so an oven's reported incidents are spread thin compared with, say, an ice maker's grip on a refrigerator corpus. Small shares over large corpora are what agreement looks like; they are not evidence that either brand is trouble-free, because nothing here counts the ovens that were never the subject of a report.
GE vs Whirlpool ovens: what the reports mention#
Both columns are shares of their own corpus, and the corpora differ in size. GE: CPSC SaferProducts incident reports for GE ovens, 2011-2026, n=960. Whirlpool: CPSC SaferProducts incident reports for Whirlpool ovens, 2011-2026, n=635. A difference no larger than one report on either side is marked "within one-report noise".
| Component mentioned | GE | Whirlpool | Difference |
|---|---|---|---|
| Igniter | 5% (44 of 960) | 4% (23 of 635) | 1 point more often for GE |
| Wiring or Power Cord | 4% (35 of 960) | 3% (17 of 635) | 1 point more often for GE |
| Control Board | 6% (57 of 960) | 6% (41 of 635) | no measured difference (within one-report noise) |
| Heating Element | 4% (42 of 960) | 4% (26 of 635) | no measured difference (within one-report noise) |
| Motor | 0% (1 of 960) | 0% (1 of 635) | no measured difference (within one-report noise) |
| Thermostat or Sensor | 1% (9 of 960) | 1% (7 of 635) | no measured difference (within one-report noise) |
About the corpus: these are CPSC SaferProducts reports — incidents someone chose to report, not units sold — so the shares on this page are shares of the reports and never a failure rate. The corpus is weighted toward safety events: 12,007 of its 20,581 records (58%) are fire, smoke, burn or melt reports, which over-represents the components that burn and under-represents the ones that merely stop working.
Do You Have the Right Tools?
Combustion analyzer ($300), igniter tester ($120), temperature calibrator ($150), and gas pressure manometer. Our technician arrives with $3,000+ in professional tools — your diagnostic is free.
Licensed & Insured · 90-Day Warranty · Same-Day Service
GE ovens: the reported component split#
GE ovens — every share in this table is a share of: CPSC SaferProducts incident reports for GE ovens, 2011-2026, n=960.
| Component mentioned | Share of reports | Reports |
|---|---|---|
| Control Board | 6% | 57 of 960 |
| Igniter | 5% | 44 of 960 |
| Heating Element | 4% | 42 of 960 |
| Wiring or Power Cord | 4% | 35 of 960 |
| Thermostat or Sensor | 1% | 9 of 960 |
| Motor | 0% | 1 of 960 |
| Water Valve or Line | 0% | 1 of 960 |
Shares of reports, not failure rates — see the corpus note above.
Whirlpool ovens: the reported component split#
Whirlpool ovens — every share in this table is a share of: CPSC SaferProducts incident reports for Whirlpool ovens, 2011-2026, n=635.
| Component mentioned | Share of reports | Reports |
|---|---|---|
| Control Board | 6% | 41 of 635 |
| Heating Element | 4% | 26 of 635 |
| Igniter | 4% | 23 of 635 |
| Wiring or Power Cord | 3% | 17 of 635 |
| Thermostat or Sensor | 1% | 7 of 635 |
| Drive Belt | 0% | 1 of 635 |
| Motor | 0% | 1 of 635 |
Shares of reports, not failure rates — see the corpus note above.
Safety First — Know the Risks
Gas ovens involve live gas lines — a loose connection creates explosion and carbon monoxide risk. Electric ovens run on 240V circuits. Our techs are licensed and insured — let them handle the risk.
Licensed & Insured · 90-Day Warranty · Same-Day Service
How to use these numbers#
What this comparison can settle: which components the reported incidents of each brand actually concentrate on, for this appliance. What it cannot settle: which brand fails more often. That would need units sold, and no public source states it. Use the component split to plan for the repair each brand is most reported for, not to rank the two.
Appliance Repair Technician · 11 years experience
Experienced technician with 11 years specializing in Frigidaire and Electrolux refrigerator and dryer repair with a focus on safety.